Homepage > Real Estate Foresight: The official May NBS data for house prices
Real Estate Foresight: The official May NBS data for house prices
Posted: 16 June, 2022
China Property - from today's data update by Real Estate Foresight: The official May NBS data for house prices (new homes) in 70 major cities shows a further decline in the Y/Y price growth to -0.8% in May from -0.1% in April on a non-weighted average basis, while the M/M figure turned less negative.
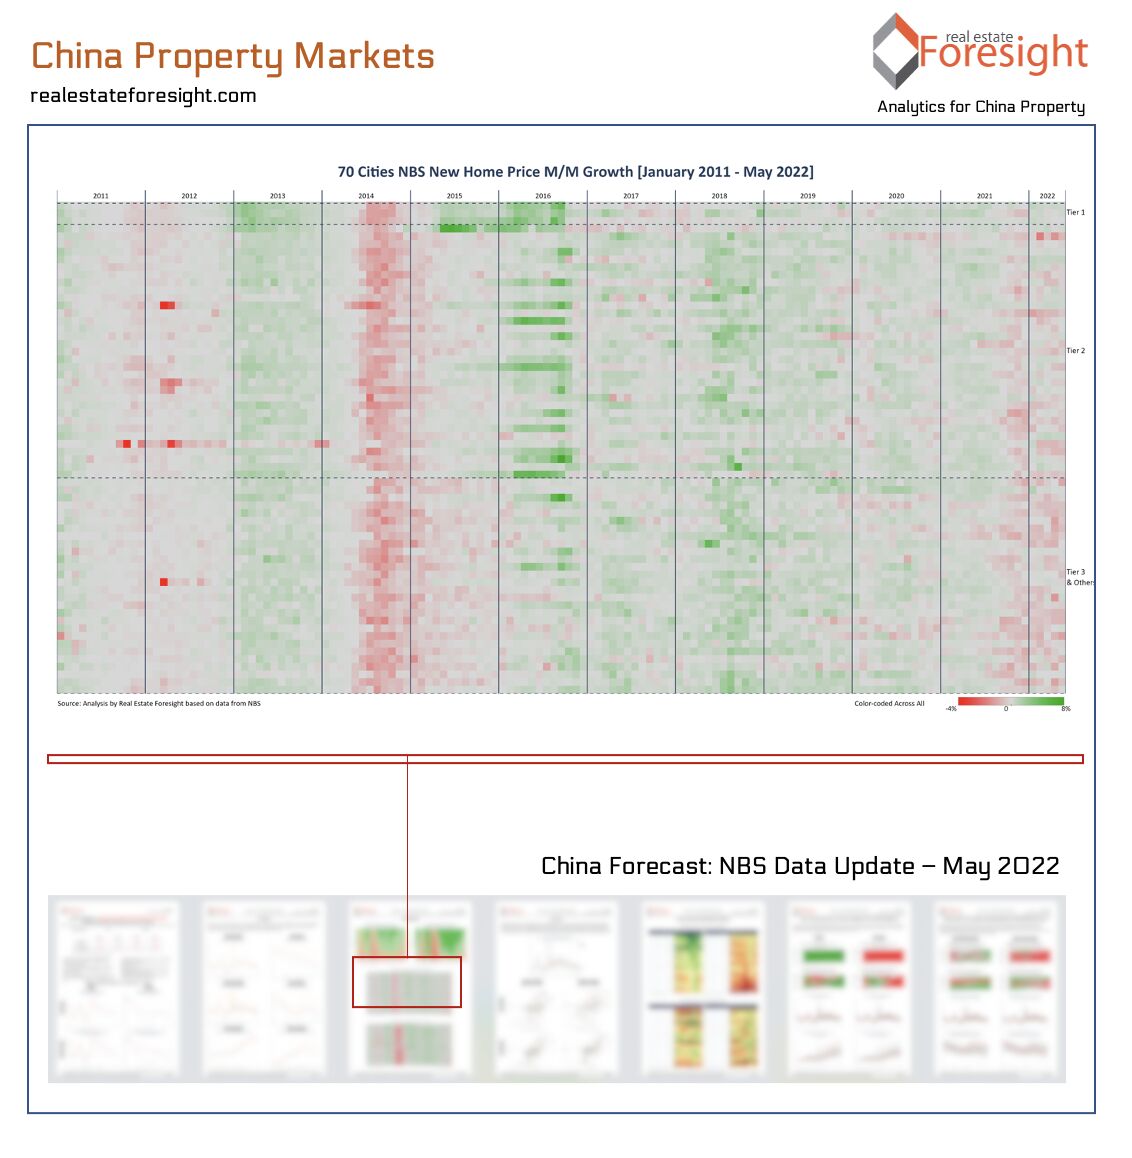
The heatmap below shows the m/m price changes each month since January 2011 for 70 major cities (each tiny row = one city). Much more red now, but not as red as in 2014.

BACK TO HOMEPAGE