Jan 20 China Property and our first NFT
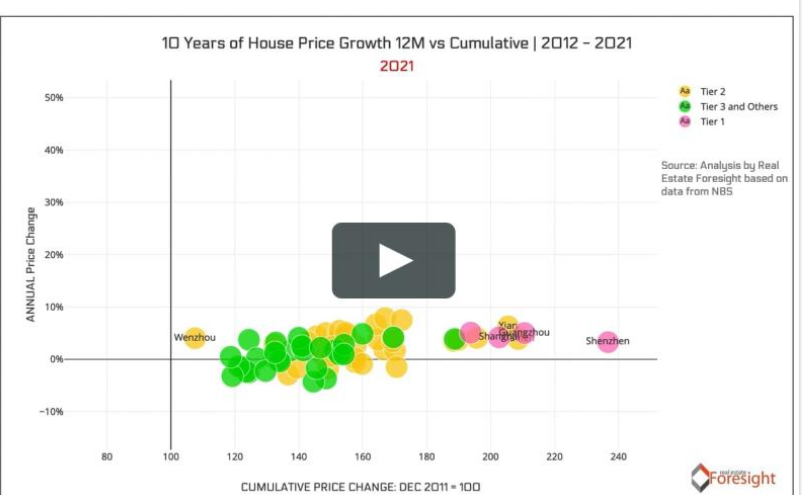
China Property... and our first NFT - 10 Years in Perspective: Shenzhen remains the big 'winner' in terms of the cumulative 10-year house price growth by the official NBS house price growth metrics among 70 major cities from 2012 to 2021, followed by Guangzhou (both the Greater Bay Area), Xiamen, Xi'an, and Shanghai.
However, it's the 2015-17 years that gave Shenzhen and some others such a boost, with all the policy measures controlling the market ever since, and a 2018-2021 version would look very different.
You can see here a broader pattern where a) most cities 'bubble up and down' from year to year on in their y/y growth; b) they are gradually rolling to the right; c) all those movements look clearly muted since 2017.
The X axis on this animation is a cumulative price growth, anchoring on December 2011 as 100, and using the annual (December y/y) data for each year. The Y axis shows the y/y change measured each December.
And to stay true to the times, we have minted our inaugural NFT out of this art! Details in the first comment below.
#China #property #research #housing #realestate #residential #developers #analytics #visualization #NFT