Homepage > China Property: The August NBS data for house prices
China Property: The August NBS data for house prices
Posted: 16 September, 2022
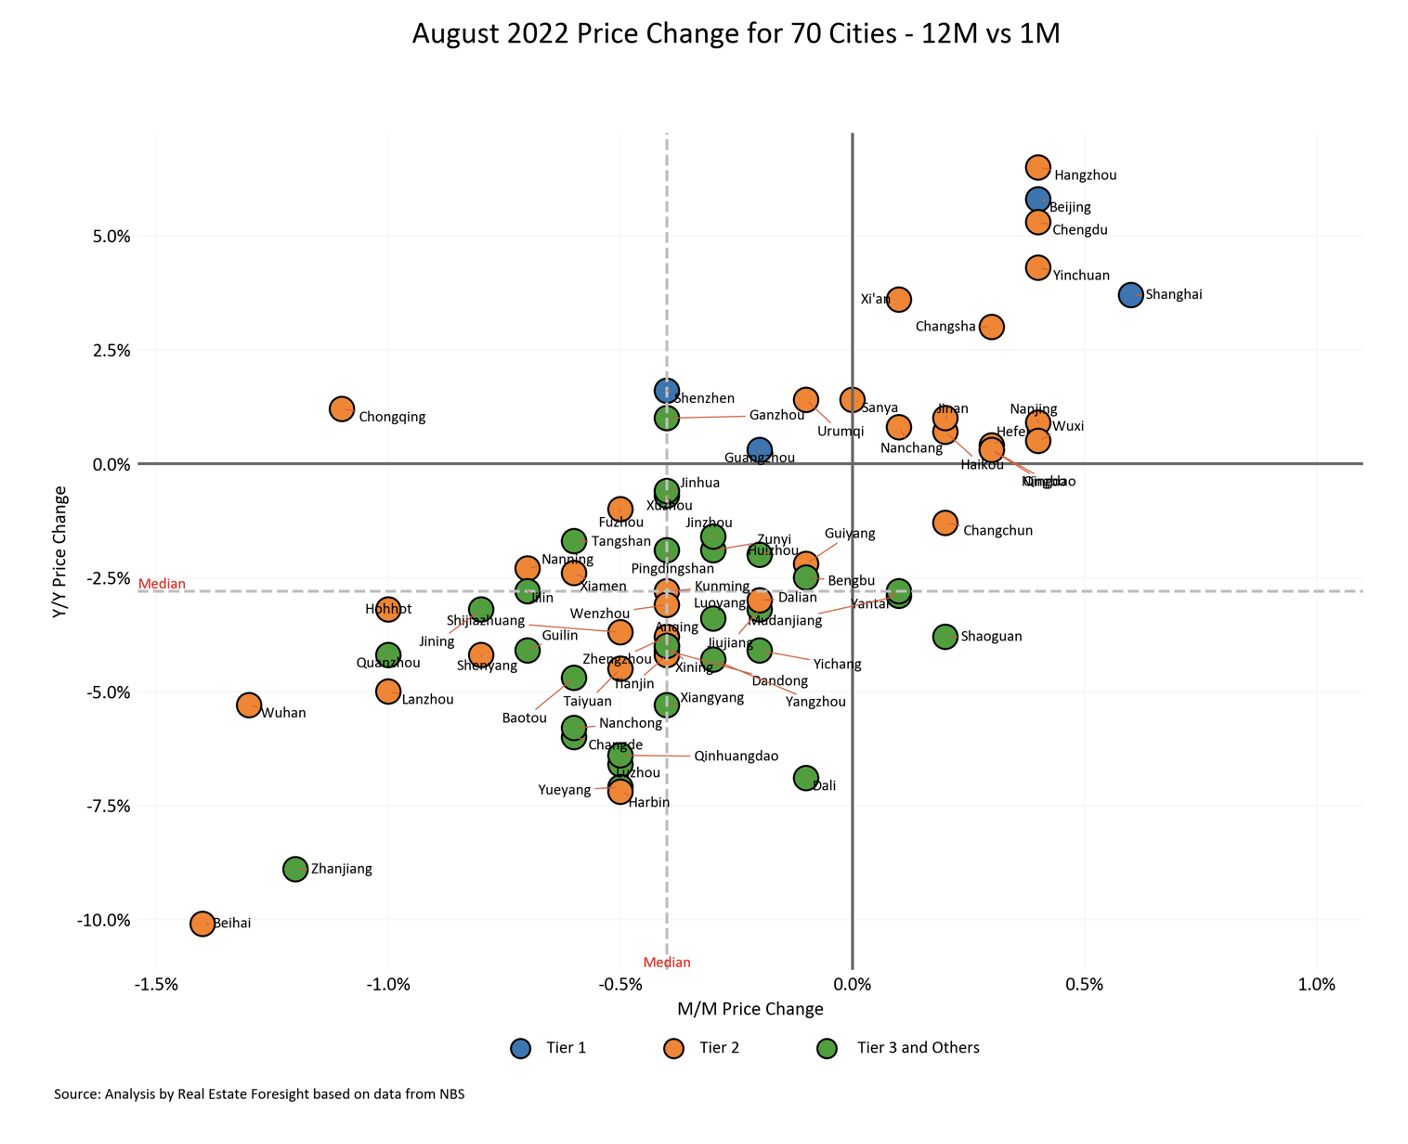
China Property: The August NBS data for house prices (new homes) in 70 major cities shows the non-weighted average Y/Y growth turned more negative -2.1% vs -1.7% in July and -1.3% in June, with a more negative -0.29% vs -0.11% M/M for July.
Interestingly, Shanghai was the top-performer M/M.
Below is the latest picture by city comparing Y/Y (Y-axis) and M/M (X-axis) house price growth rates. From today's Real Estate Foresight's Data Update.
BACK TO HOMEPAGE