China's official NBS new home sales data is normally published mid-month for the prior month (except January-February are covered cumulatively in March) and serves as an important macro indicator. The October data is due tomorrow, on Friday, November 14.
In our research at Real Estate Foresight, we use a higher-frequency indicator to approximate the direction of what to expect from such monthly NBS data. 'Higher frequency' is a relative term, and in this case, we look at the weekly CREIS data. We consider the daily data too noisy.
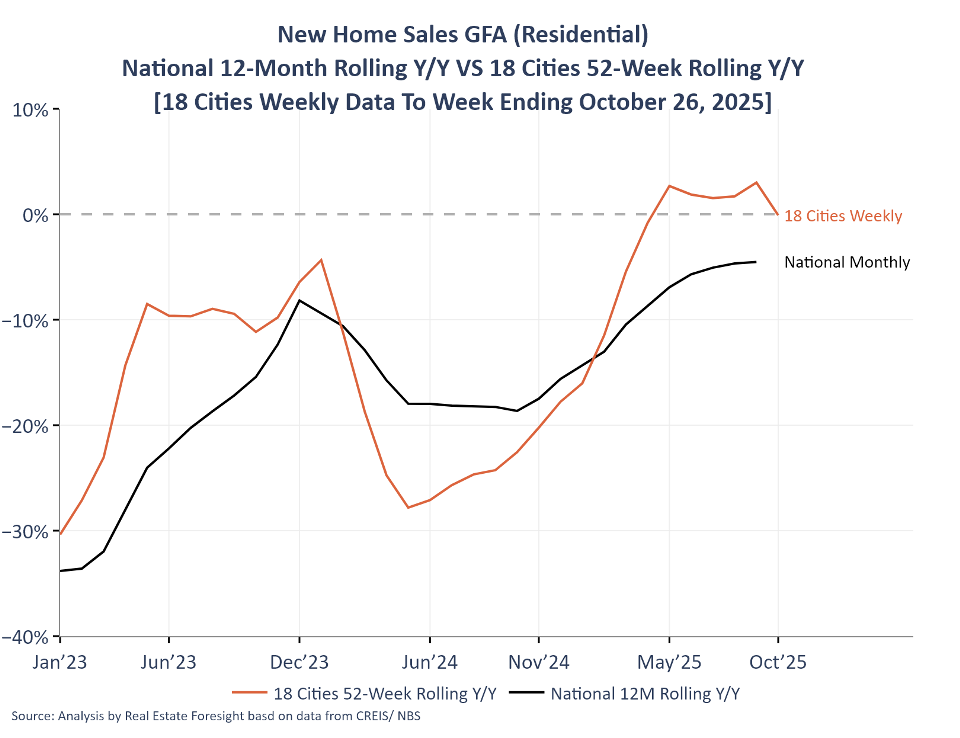
Based on that weekly data, we track new home sales in around 18 major cities, and the 18-city aggregate metric we calculate tends to indicate the direction of the monthly national NBS figure (here in terms of the 52-week / 12-month growth metrics to the week ending on October 26):
The shorter-term metrics for the 18-city aggregate show larger variations - the 4-week vs the equivalent 4-week period a year ago (the orange line) ranged from over +50% earlier in the year, to well below -20% recently.
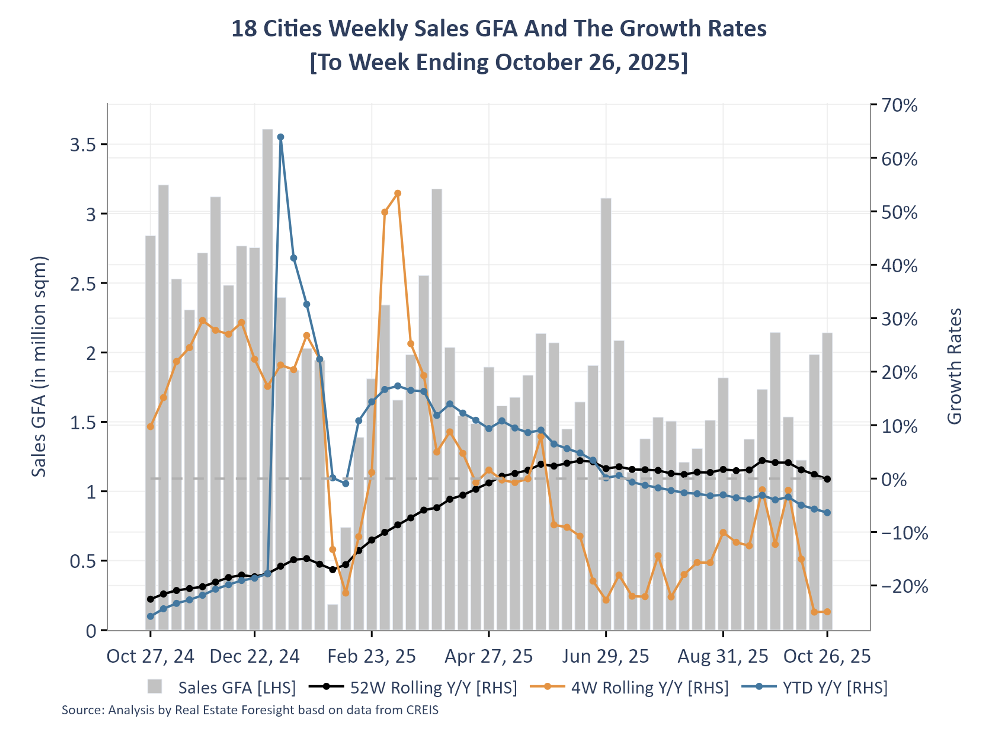
The recent significant deterioration in the shorter-term year-on-year measures reflects a high base for comparison, as it was in September/October last year when the new wave of policy support measures was released and the market reacted positively at the time.
Hence, the likely upcoming 'weak sales growth figures' news should also be seen as not surprising.
Aside from the direction of the growth rate, the major cities have been outperforming other aggregates - see this previous post on "New Home Sales By Various Measures".