The heatmap below illuminates 14+ years of month-on-month price changes for new homes (each tiny column is a month) across 70 major cities (each tiny row is a city), using the official NBS price growth indices, as of September 2025.
It is colour-coded across the whole period (green for positive, red for negative).
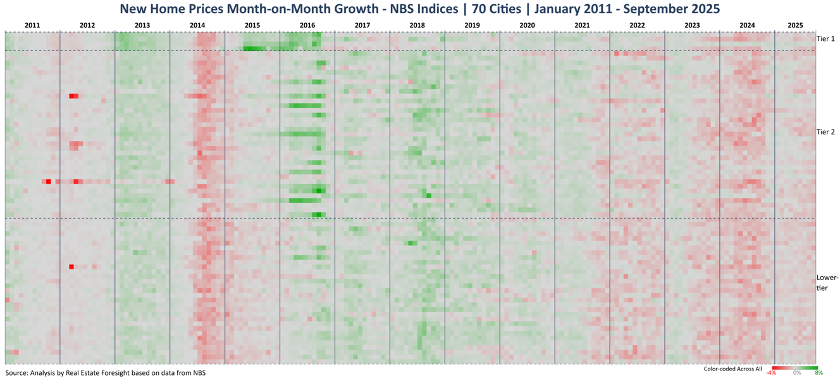
It shows the longest and largest downturn/ structural shift taking place over the past 4 years, driven by the policy push (esp. in 2019-2020) to curb the excesses of the sector.
Notice the 'bits of green' in early 2023 and then early 2025, but the 'red' dominates the last 4 years, currently with no signs of month-on-month improvements.
We find this NBS data to be directionally accurate (vs the reality checks), while the actual percentage figures may be distorted (across the cities) by composition changes and the earlier rules on price floors (here, the local policies can vary significantly).
Arithmetically, it's possible, for example, for a city to show a positive growth for new home prices thanks to the sales of higher-end properties, even if these higher-end properties offer/sell at discounts.