China Property Signals (#39): 'Bubbles In Motion' Or New Home Prices In The 5-Year Downturn - Animation
About this Newsletter: Get a quick but more granular view of (still) one of the most important sectors in China, with the weekly chart and commentary from Real Estate Foresight (REF) - drawing on 14+ years of REF's research on China housing markets.
This 'bubble chart animation' below takes you through the last 5 years of the China housing market downturn, with its mini-cycles in-between.
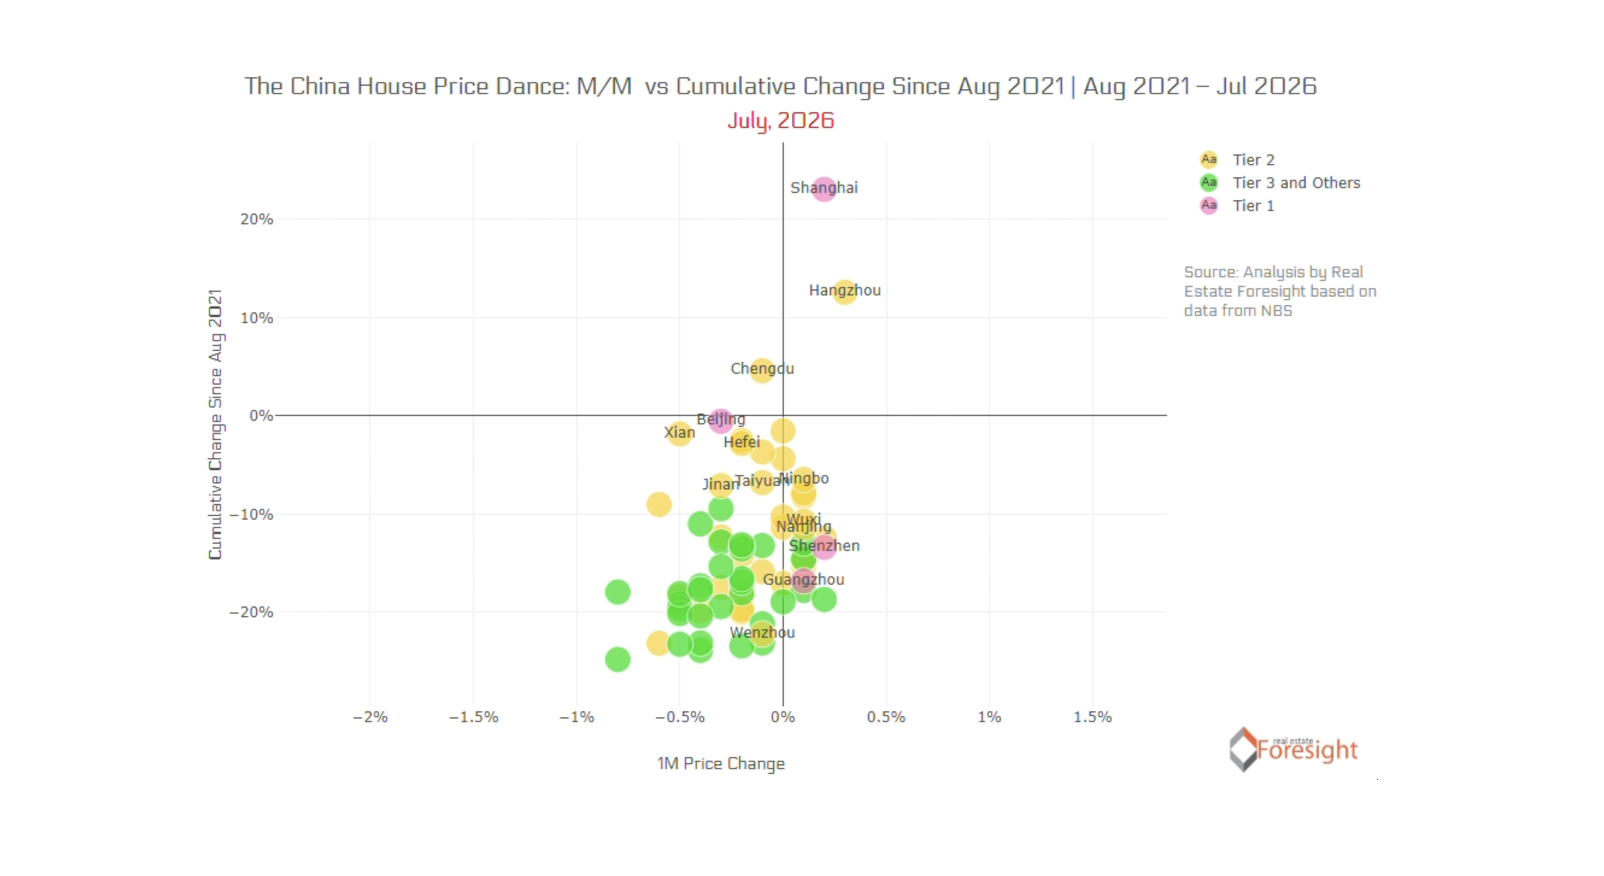
Starting with August 2021 as a base (the market for now the 5-year 'anniversary'), watch the changes in the month-on-month new home price growth rates for each of 70 major cities (using NBS data) on the X axis, and the cumulative price change effect on the Y axis.
The actual percentage changes for these growth indices need to be interpreted with some caution vs compositional changes, especially in recent years - where in some cities the luxury segment has sold well, pushing the averages up. But we do believe the data presents a solid view of the relative performance of cities.
Notice how Shanghai and Hangzhou have consistently remained at the top Y/Y and stand out from the rest, almost all in the 'bottom-left corner'; and the four Tier-1 cities are quite spread across in their cumulative performance.
See the animation below (or here on Vimeo if the playback below doesn't work):
Here's the latest static picture for July 2026:
September 2026 also marks our 14th anniversary of publishing (continuously) the monthly China Property Report, one of the regular REF publications. Here's a flip-through of the current structure (in a blurred format):