China Property Signals (#30): Home Prices Since The 2021 Peak
About this Newsletter: Get a quick but more granular view of (still) one of the most important sectors in China, with the weekly chart and commentary from Real Estate Foresight (REF) - drawing on 14+ years of REF's research on China housing markets.
It's been 5 years since the Chinese housing market peaked in 2021 (depending on the exact measure), including new home prices in August 2021 - using our calculated 70-city average.
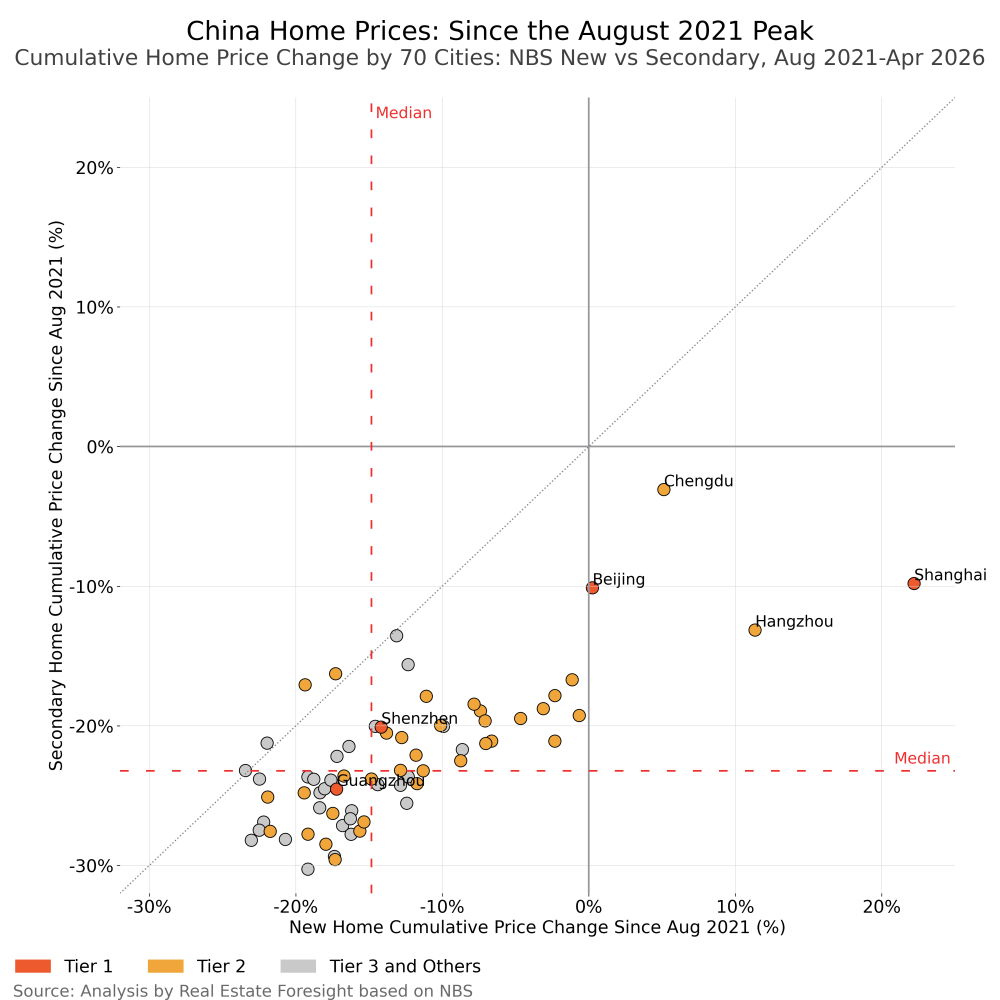
The chart below shows the cumulative price change since August 2021 (through April 2026) across major cities, using the official NBS measure for NEW HOME PRICE GROWTH INDICES (X-axis) and the SECONDARY HOME PRICE GROWTH INDICES (Y-axis). For city-level comparisons, this provides a fair picture of relative performance, though see the data caveats further below regarding the percentage point figures.
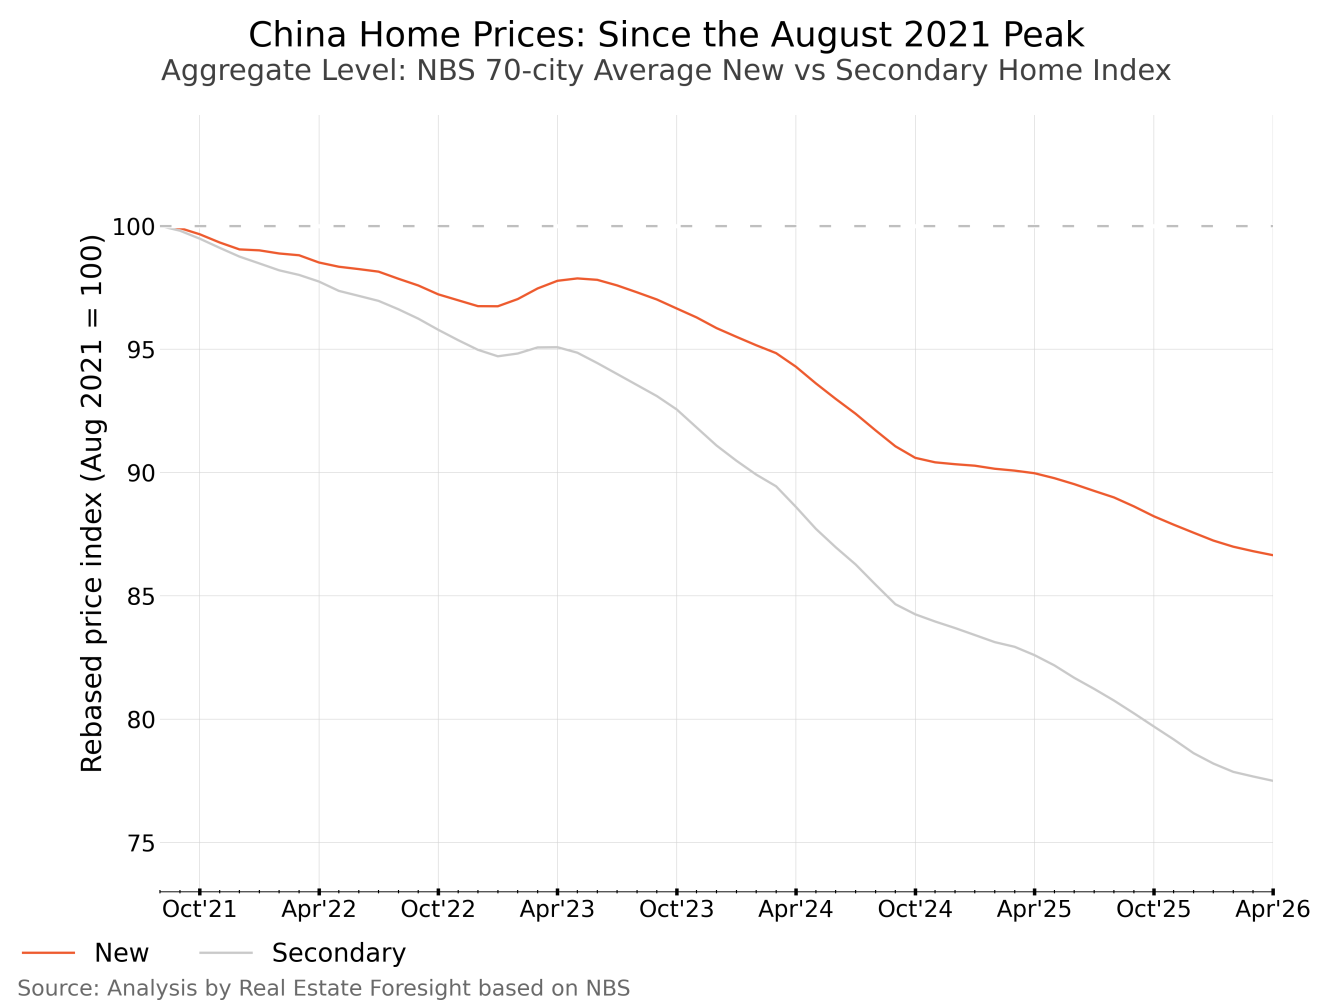
And at an aggregate level (calculated simple averages for 70 major cities), rebased to August 2021 = 100, for new and secondary homes:
Several data caveats apply:
-These are index-level changes (aggregate and city-level), where the on-the-ground feel for new homes would be typically closer to a 30% like-for-like decline, and a larger drop for the secondary
-Composition change (the shift to higher-end products in some cities, more lower-end in others) at overall lower volumes - all impact the averages, especially for the new home sales
-Price caps and floors for new homes can also distort the picture, with no such restrictions in the secondary markets
-NBS price growth indices tend to cover core city areas