China Property Signals (#28): More Headline-Level Media Talk About 'Market Recovery'
About this Newsletter: Get a quick but more granular view of (still) one of the most important sectors in China, with the weekly chart and commentary from Real Estate Foresight (REF) - drawing on 14+ years of REF's research on China housing markets.
The changes in how the local Chinese media cover certain topics at the headline level can be quantitatively illuminating, reflect the current sentiment, or even be predictive.
The chart below (data to April 28, 2026) shows that the 'talk' about market recovery (the orange line) has been recently trending up, albeit from the low relative levels. This sits in contrast to the talk about the supportive policy (the blue line) that has been trending down. Note how the spikes in 2024 reflect the policy stimulus measures introduced at the time.
The weekly data (for select major cities we track) also indicates some improvement in April, keeping in mind, though, how the last few years saw a few periods of early-year pickup that later reversed.
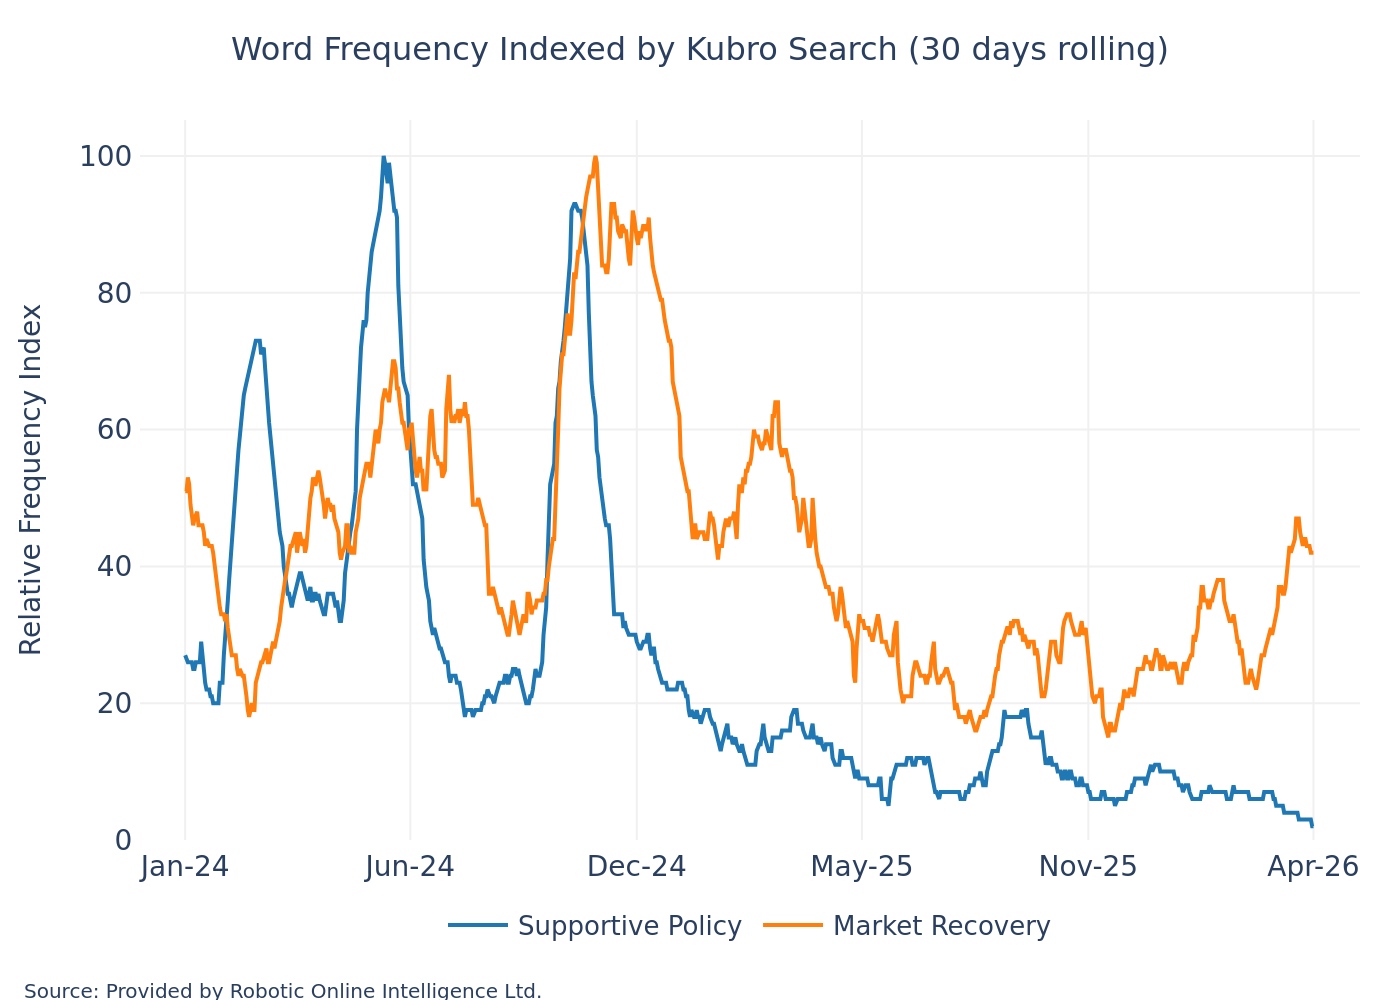
For the chart / data above - technically, we calculate the relative word frequency indices for the predefined groups of keywords (in Chinese, although we present the results in English) to capture headline-level coverage by major publicly available Chinese media sources online.
The indices are set to Max = 100 per data series, which is important to 'remember' where the equivalent really was, say, a year ago.
We have been using this method since 2017, developed at the sister venture Robotic Online Intelligence (ROI) and the Kubro(TM) platform - where we apply it to different sectors and use cases.