China Property Signals (#26): A Brief Look At The Latest House Price Data (March 2026)
About this Newsletter: Get a quick but more granular view of (still) one of the most important sectors in China, with the weekly chart and commentary from Real Estate Foresight (REF) - drawing on 14+ years of REF's research on China housing markets.
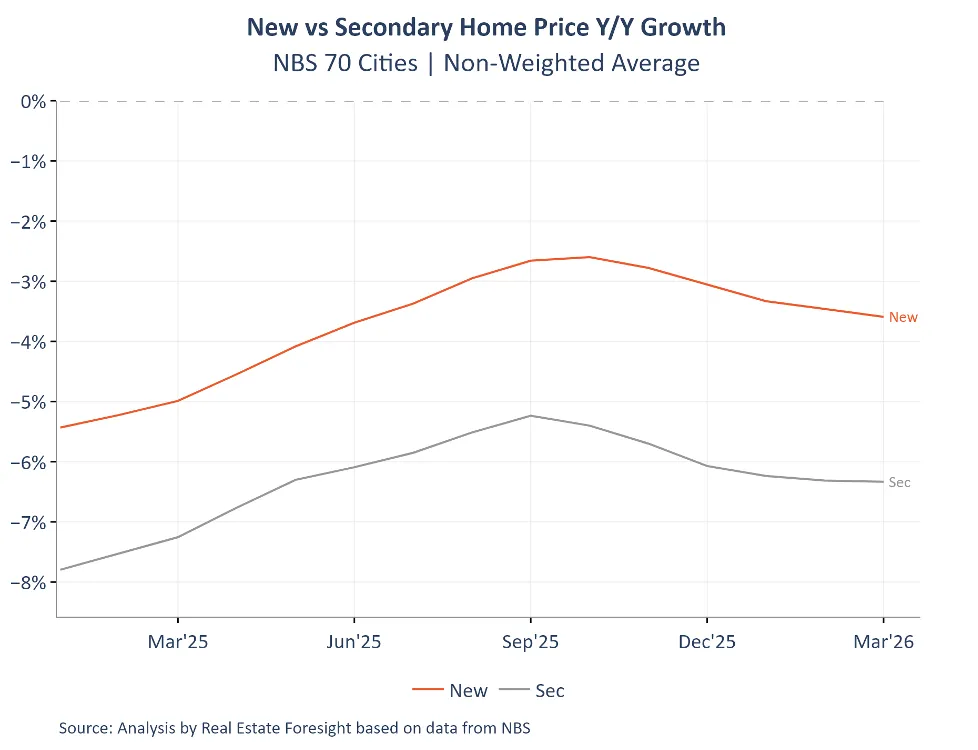
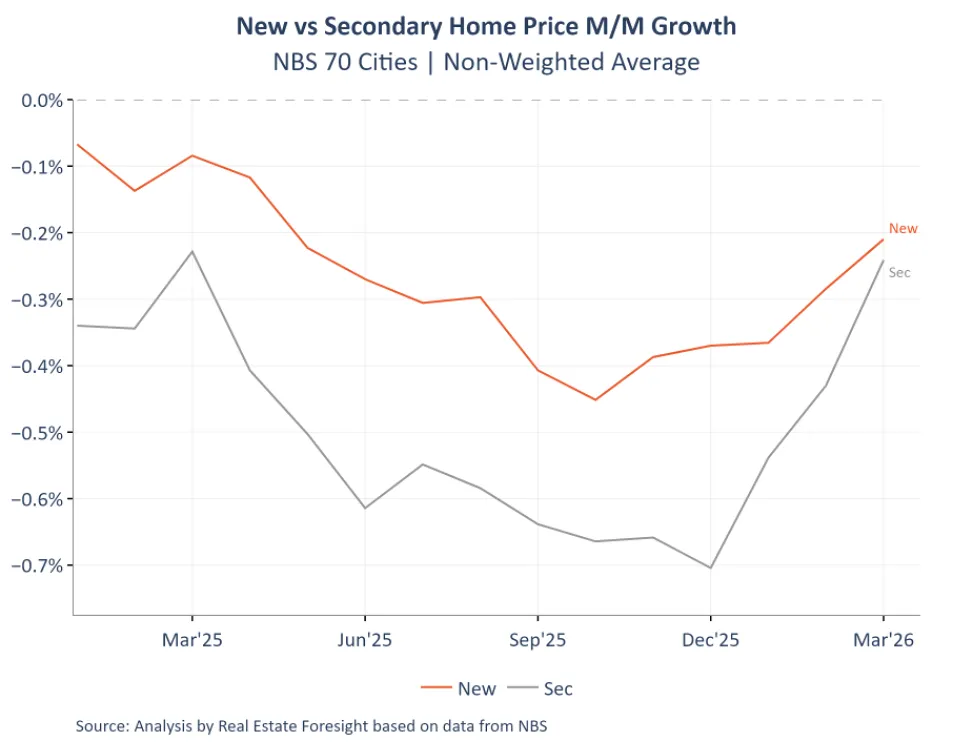
Based on the official NBS home price indices for 70 major cities, released last week:
Overall, the aggregate NBS March y/y metrics turned slightly more negative for both new homes and secondary homes, while the m/m figures turned less negative for both:
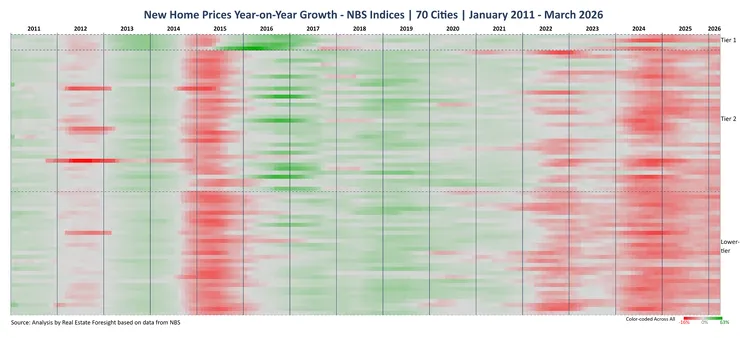
To put the current market into a longer-term perspective on new home price changes y/y, see this heatmap (here we use red for negative growth, green for positive, colour-coded across the full history), where each tiny row represents a city, and each tiny column represents one month, starting from January 2011:
These are the extracts from REF's Data Update published to clients last week: