About this Newsletter: Get a quick but finer view of (still) one of the most important sectors in China, with the weekly chart and commentary from Real Estate Foresight (REF) - drawing on 13+ years of REF's research on China housing markets.
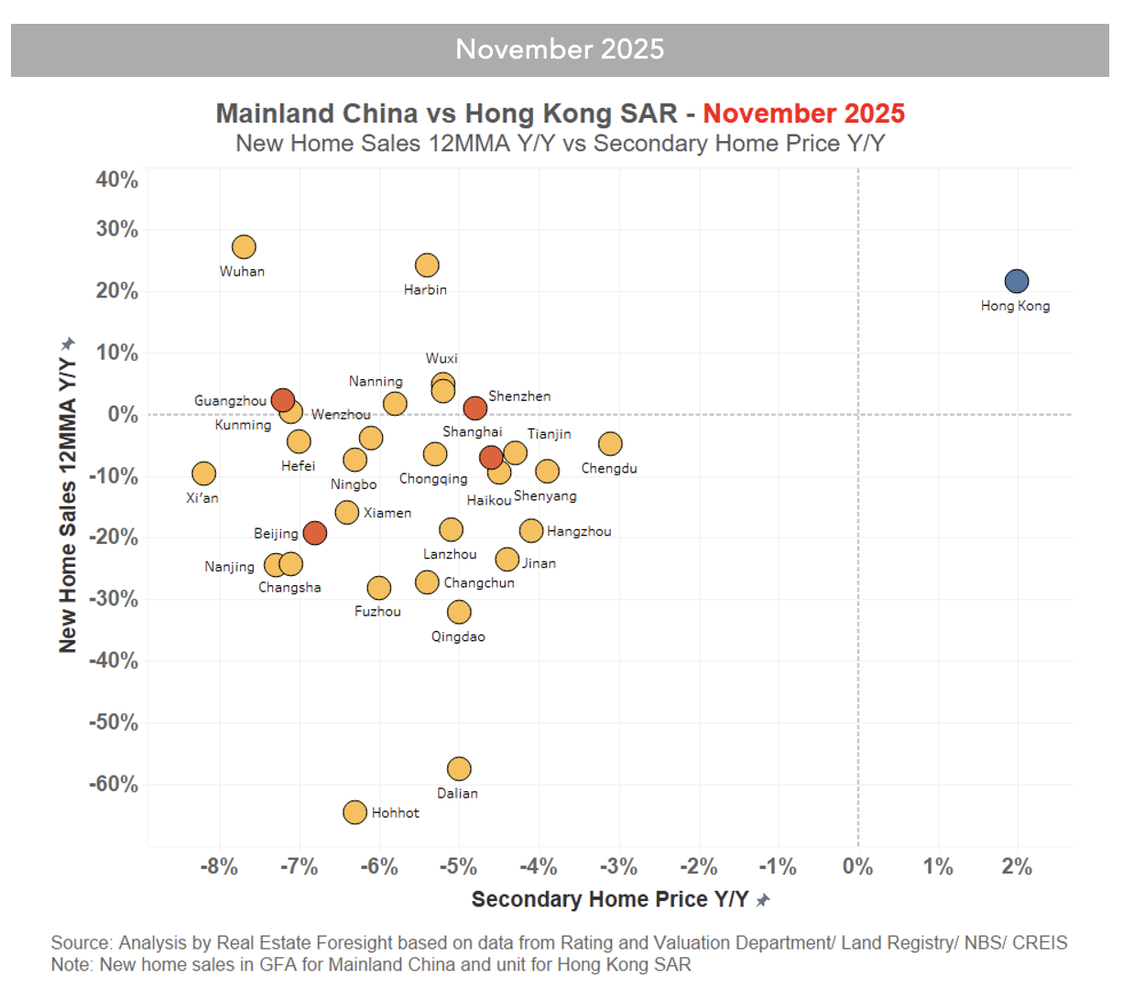
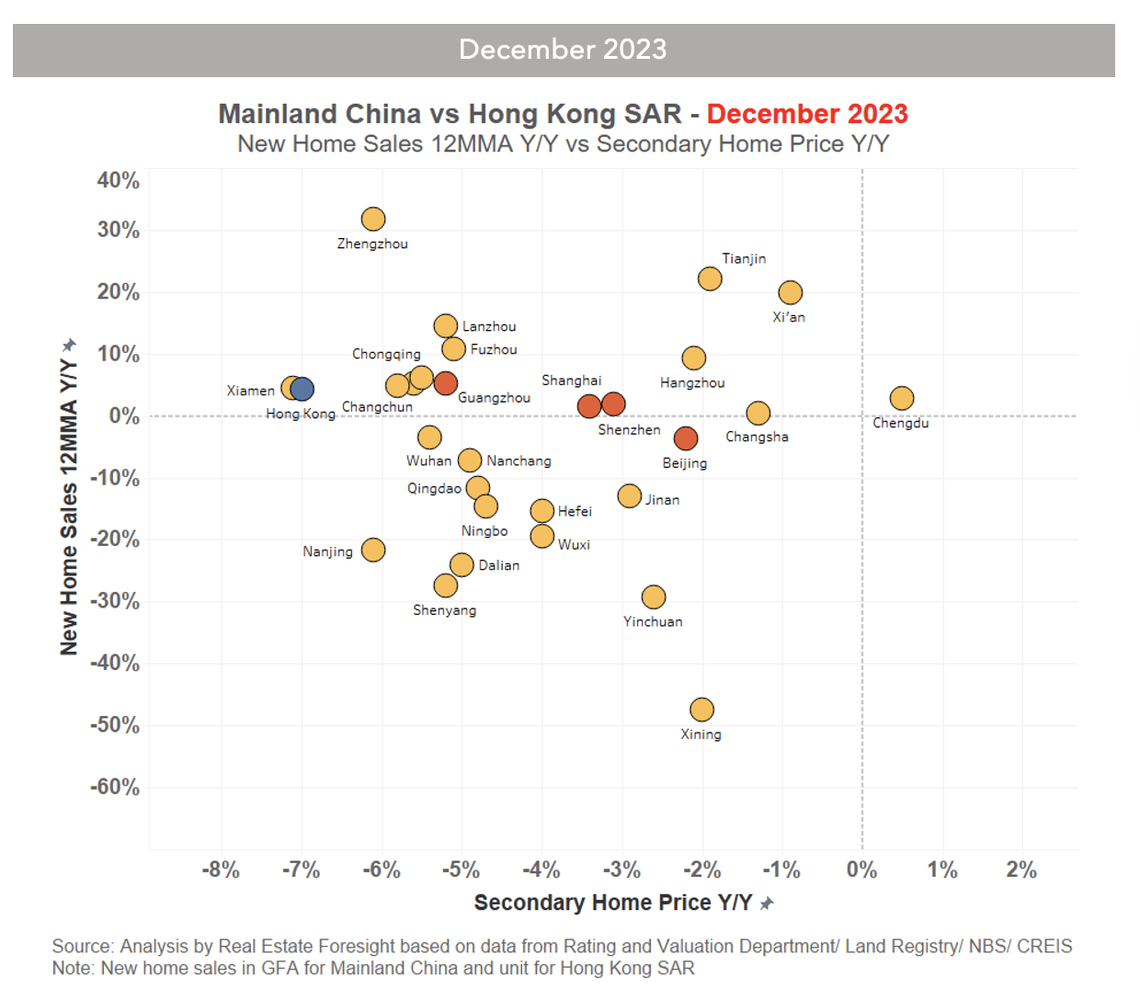
By some housing market growth metrics, Hong Kong 'performance' has changed dramatically in the past 2 years (Dec 2023 vs Nov 2025) compared to the Mainland cities.
We show it using a rather unusual chart.
There is no easy comparison of the housing markets between Hong Kong SAR and the major cities in Mainland China as the metric availability and calculation methods vary.
However, we view the following two metrics as each reasonably comparable across Mainland cities and Hong Kong in terms of growth rates, even if technically quite different:
-New home sales growth rate (in GFA for Mainland cities - based on CREIS data, around 68% is pre-sale in Mainland - vs - in units for Hong Kong, from HK government data).
-Secondary home price growth (city-level NBS price growth indices for 70 cities on the Mainland - vs - the HK government data for the secondary home price index for Hong Kong).
The first chart depicts the growth rates as of Nov 2025, and the second as of Dec 2023.
In this unusual combination, we overlay the primary home sales measure (12M vs prior 12M) on the Y-axis and the secondary price growth (Y/Y) on the X-axis, the scales are the same in both charts.
See what a difference these 2 years made for Hong Kong - the blue circle: