About this Newsletter: Get a quick but finer view of (still) one of the most important sectors in China, with the weekly chart and commentary from Real Estate Foresight (REF) - drawing on 13+ years of REF's research on China housing markets.
In the chart below, we compare the Y/Y growth rates for new home prices at a city level (by the NBS measure) as of December 2025 (Y-axis) and December 2024 (X-axis).
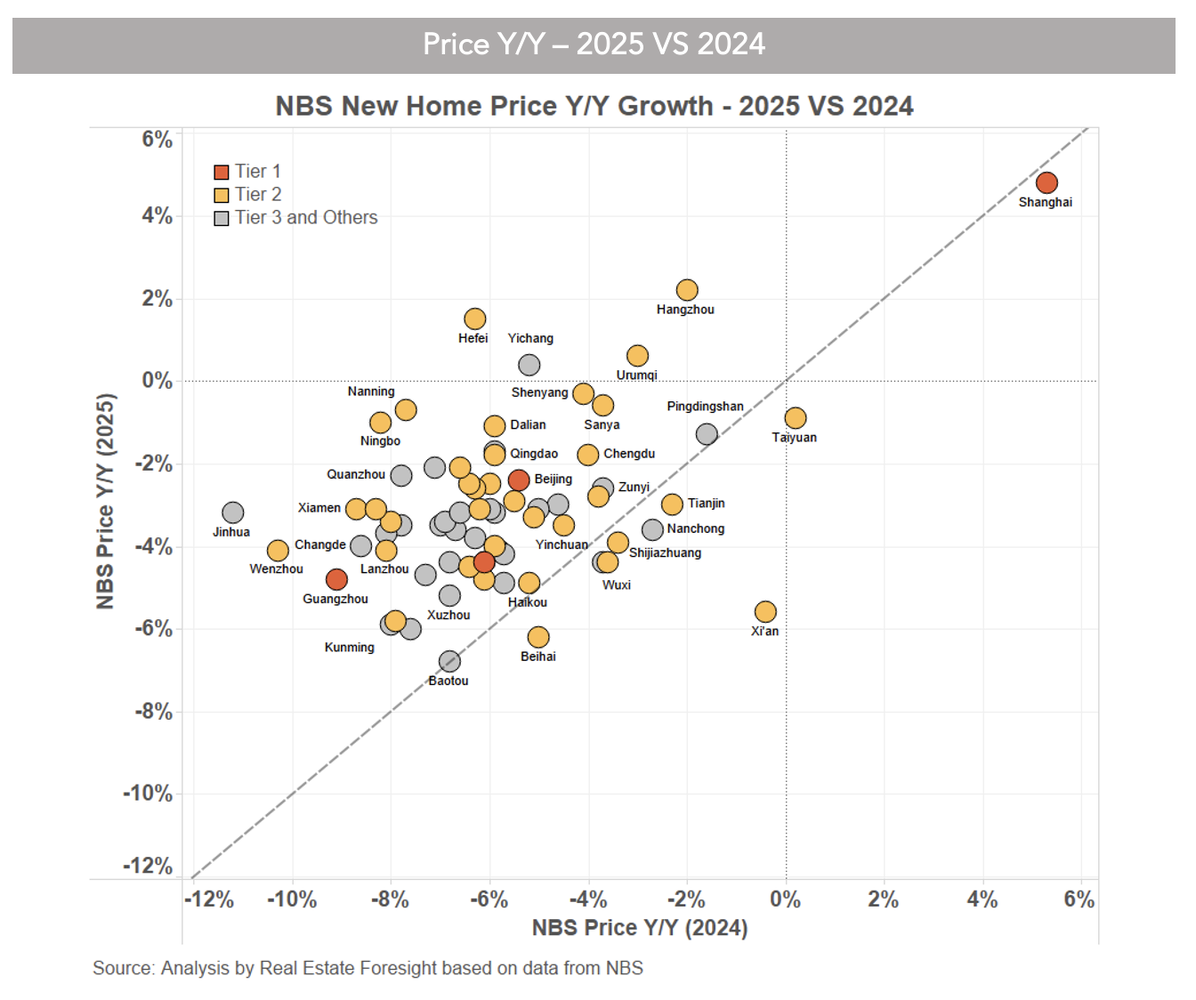
Shanghai remains the big outlier and (relative) outperformer.
Most cities turned less negative (above the 45-degree line) in this annual view, despite the more negative moves in the past few months since September 2025 (not visible in this chart).
Among the major cities, Hefei stands out with the biggest 'improvement' in the growth rate in 2025, while Xi'an has the extended decline.
The usual data caveats apply - product and location composition change, difference in local policies, and structural shifts, all of which impact the indices. Arithmetically, it's possible for a city to show a positive growth for new home prices thanks to the sales of higher-end properties, even if these higher-end properties offer/sell at discounts.