'Completed-not-Sold' Inventory on the Rise
Assessing the China residential inventory levels and the pace of clearing is notoriously tricky, given limited, consistent data and the data definition caveats. We normally focus on 20 major cities and use the available-for-sale figure (under construction units with permits to sell plus completed unsold units) and the 6-month pace of sales. Historically, the 'under construction' part was the vast majority of the inventory.
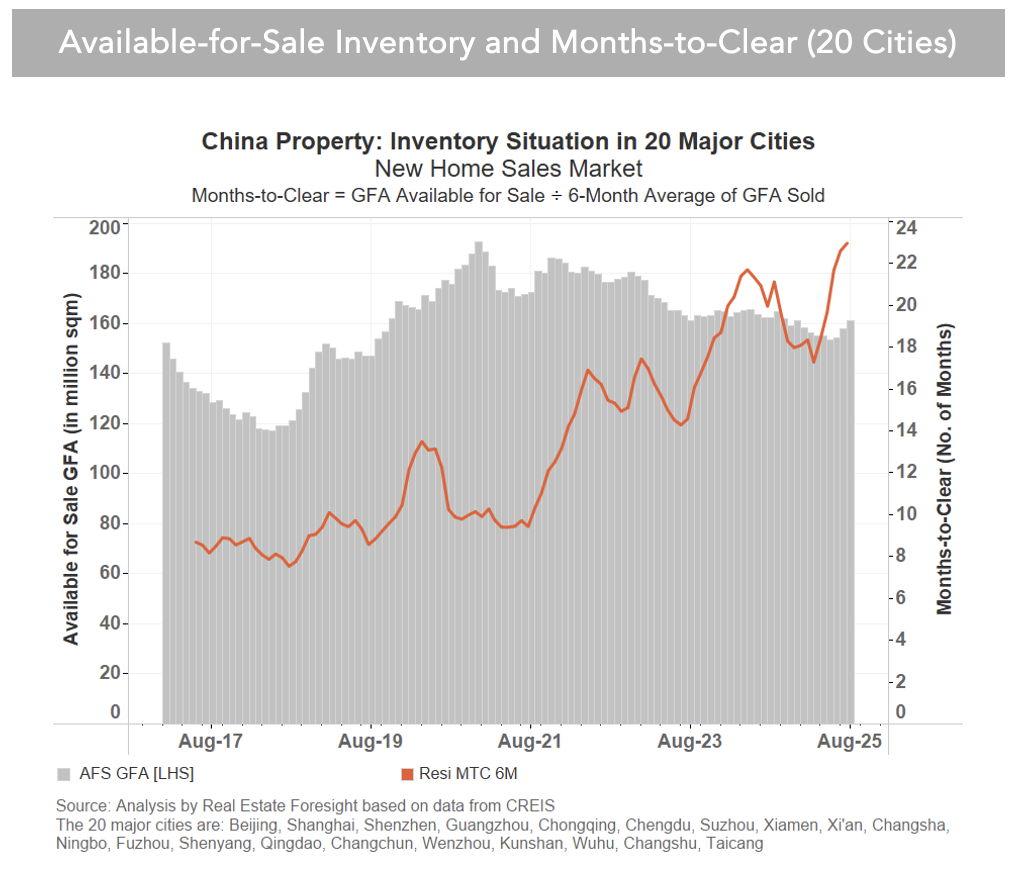
Now, however, a larger portion comes from unsold completed units. For example, in Guangzhou, according to CRIC, 51.3% of the available-for-sale inventory was completed and not sold, and 48.7% was under construction with permits to sell (June 2025).
At a national level, it shows in the NBS data for completed unsold inventory (the chart below) increases in recent years.
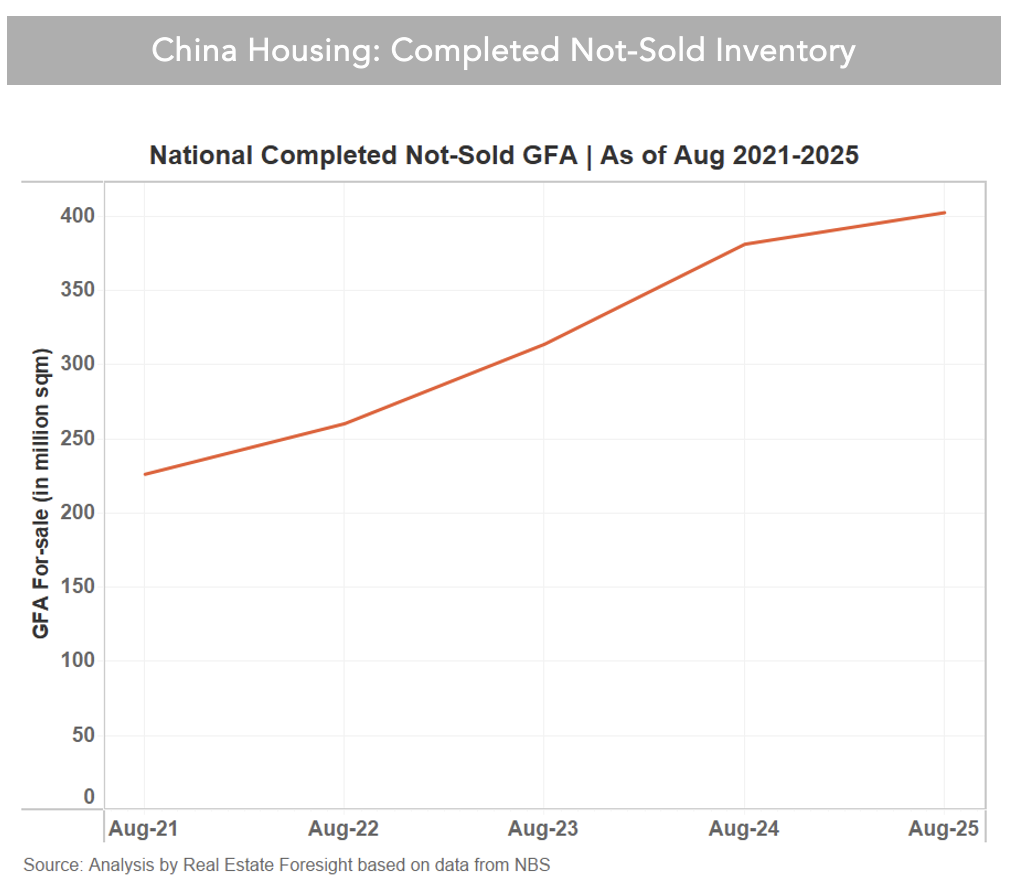
A few factors are at play here:
1) continued weakness (less negative but still declining) in new home sales;
2) demand shift to secondary markets (as our data analysis on 10 major cities shows, +15% for secondary vs +1% for primary, 12M y/y as of August 2025);
3) a push for completions - as developers are pushed to complete the pre-sold units, they will complete the whole towers where there could be many unsold units, adding to the unsold completed inventory.
New starts remain in big decline, as does the GFA of land sales, hence the supply is coming mainly from the existing/past projects.