China Property Report - Market Recovery vs Policy Support
China Property: Data for Jan-Feb, and partial March and early April signals further improvement in the underlying housing market, but that also means not much new policy support for the sector.
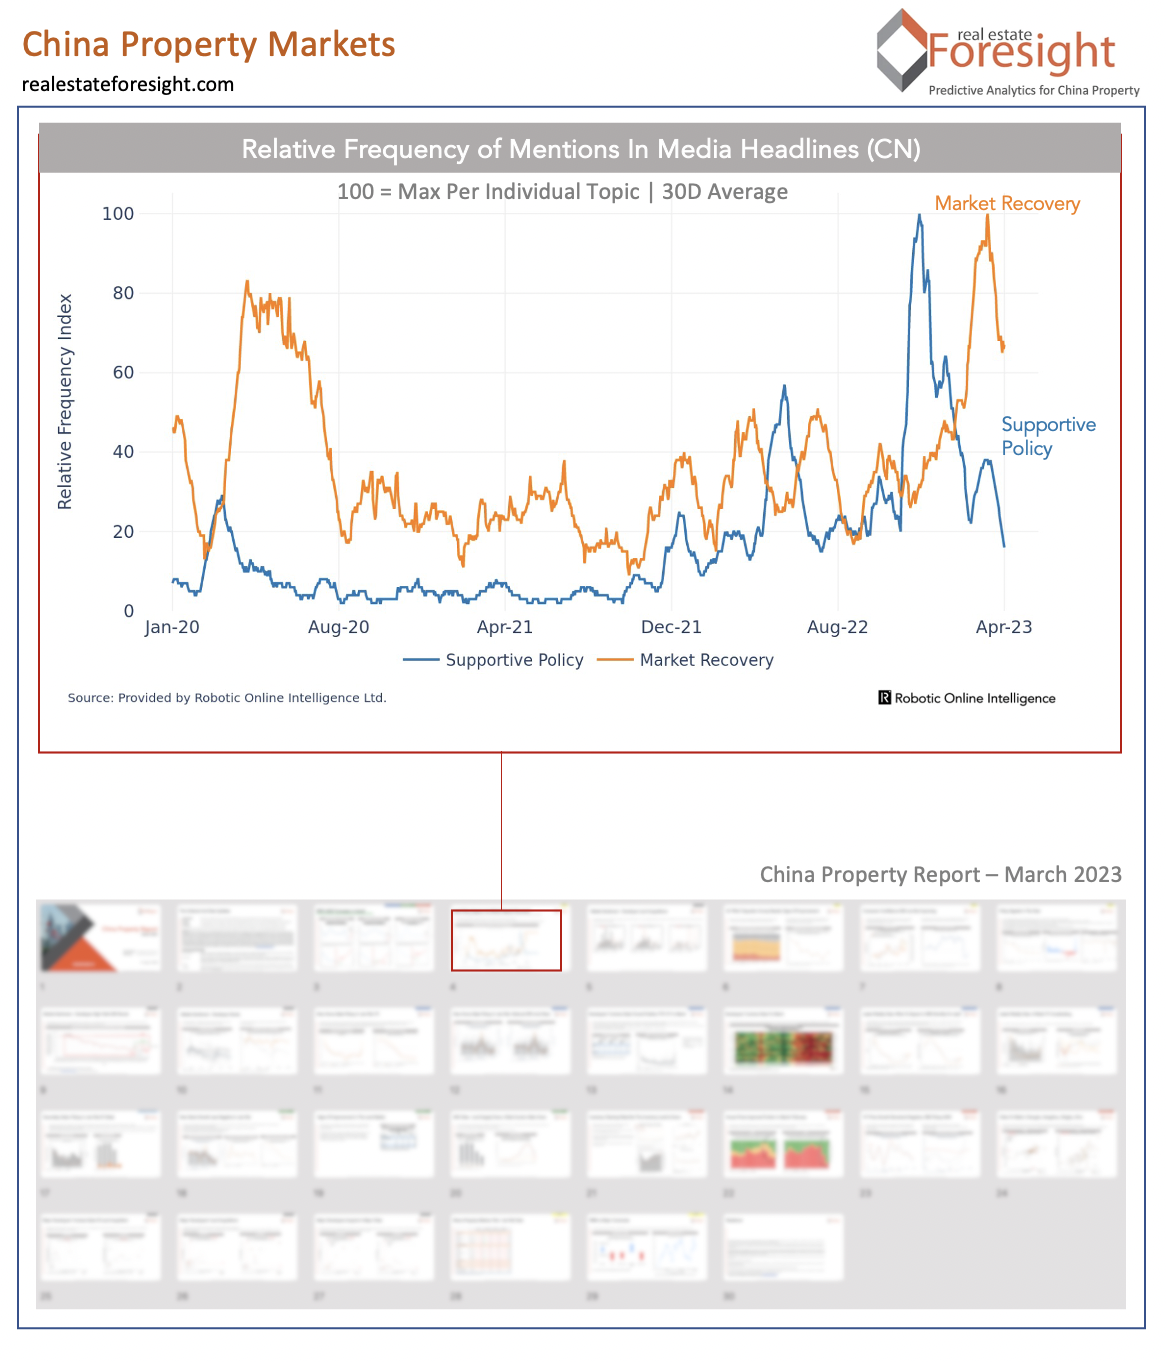
The chart below captures that sentiment, tracking the relative frequency with which certain terms for 'market recovery' and 'policy support' appear in the news media headlines locally.
Yesterday, we published the latest China Property report by Real Estate Foresight, going into the very details of all the key metrics of sales, prices, land, inventory, and macro factors, and our reasoning for the outlook for the rest of 2023.
Latest housing market data highlights:
New Home Sales: Weekly for 19 cities to Apr 9: YTD y/y accelerating to +11% vs -8% to Feb 26; 12-month (52-week) at -22% vs -33% for the same cities at the end of 2022; 4- week y/y accelerating to +46%; Major 25 developers for Jan-Mar: turning positive +4.6% y/y vs -37% for 2022.
House Prices: A jump in the number of cities with rising m/m prices by NBS measure for Jan-Feb (55 of 70); by CREIS for Jan-Mar (41 of 100); NBS 70 cities average: -1.9% for Feb vs -2.3% y/y for Jan, turning positive +0.30% m/m vs flat for Jan; CREIS 100 cities average: staying at -0.36% y/y for Mar, same as Jan-Feb, flat m/m, marginally improving further - but “practically staying at zero/flat”.
Inventory: 20-cities Feb Months-to-Clear at just under 17 remains the worst in history but it’s due to low sales, while inventory (’available for sale’) has declined further.
Land Sales: Jan-Mar land sales turned less negative by most metrics compared to Jan-Feb; -28% / -27% YTD y/y (GFA / Value) for 57 major developers; -33% / -16% for 340 cities; -14% / +1% for 40 cities.