China Property: If Cities Were Stocks - Correlation Patterns
China housing is not one market, but it is not 600 entirely different markets either.
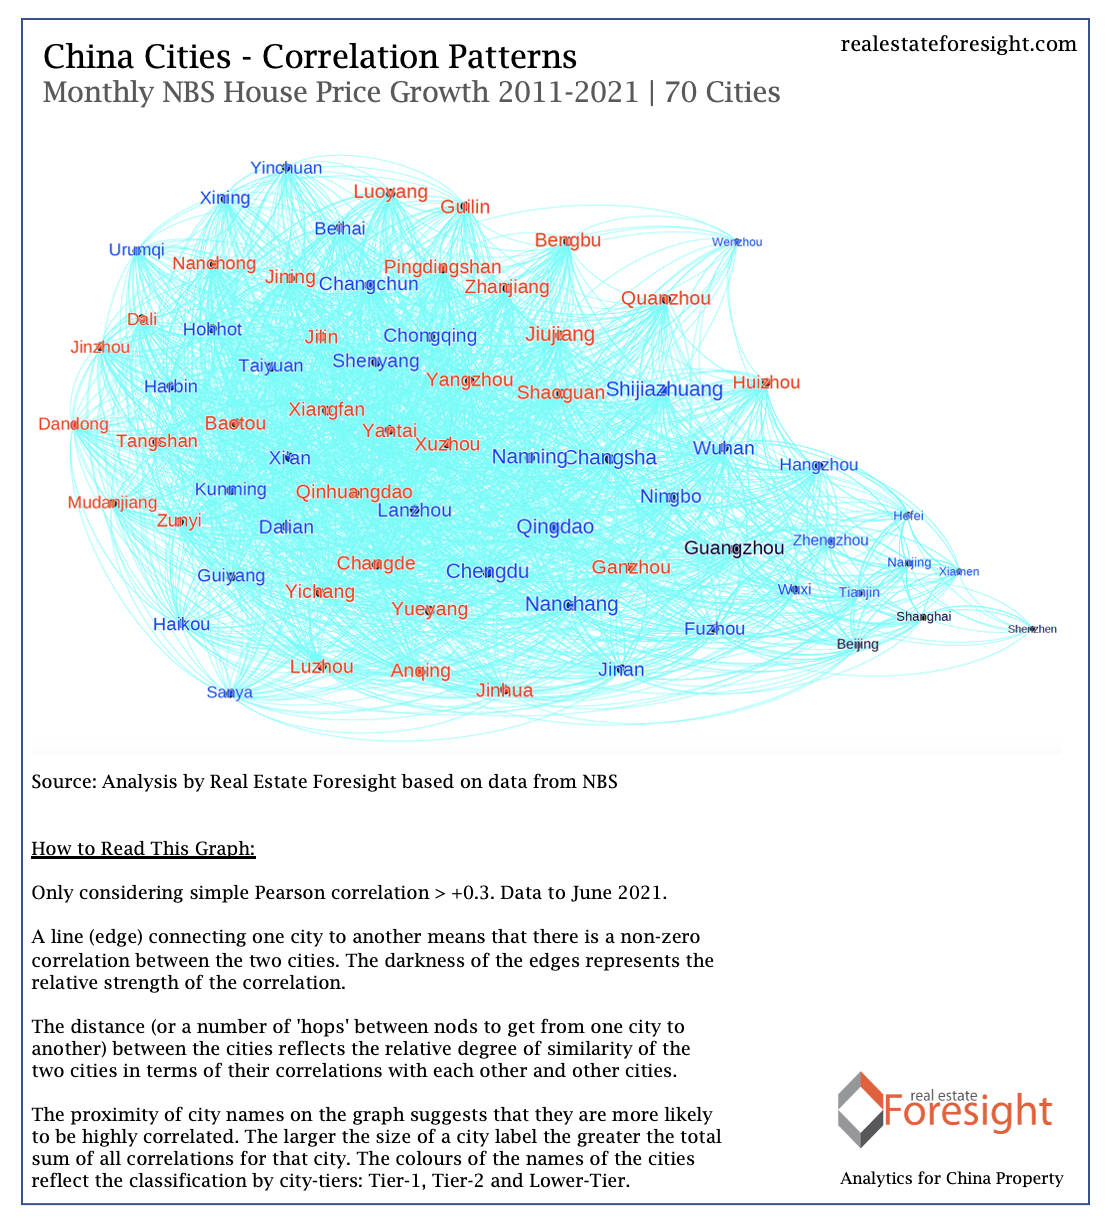
There are some clear patterns in how some cities behave similarly in their direction of the house price growth, and some exhibit very unique behaviour.
A finer understanding of these patterns can help developers better assess the risk in city selection strategies for new investments or of an existing portfolio, including diversification considerations.
To do that, we quantitatively assess and visualize which cities are most 'unique' in their patterns of price movements and which are most similar to each other.
Shenzhen, Wenzhou, and Sanya are among the most unique cities in terms of their house price growth correlation patterns among the 70 major Chinese cities, for the period from 2011 to 2021 (June). See the graph below, along with the 'how to read this' notes.
Naturally, house prices is just one metric. In Real Estate Foresight CityScreener(TM) city attractiveness assessment models we would look at 20-30 metrics in multiple categories.