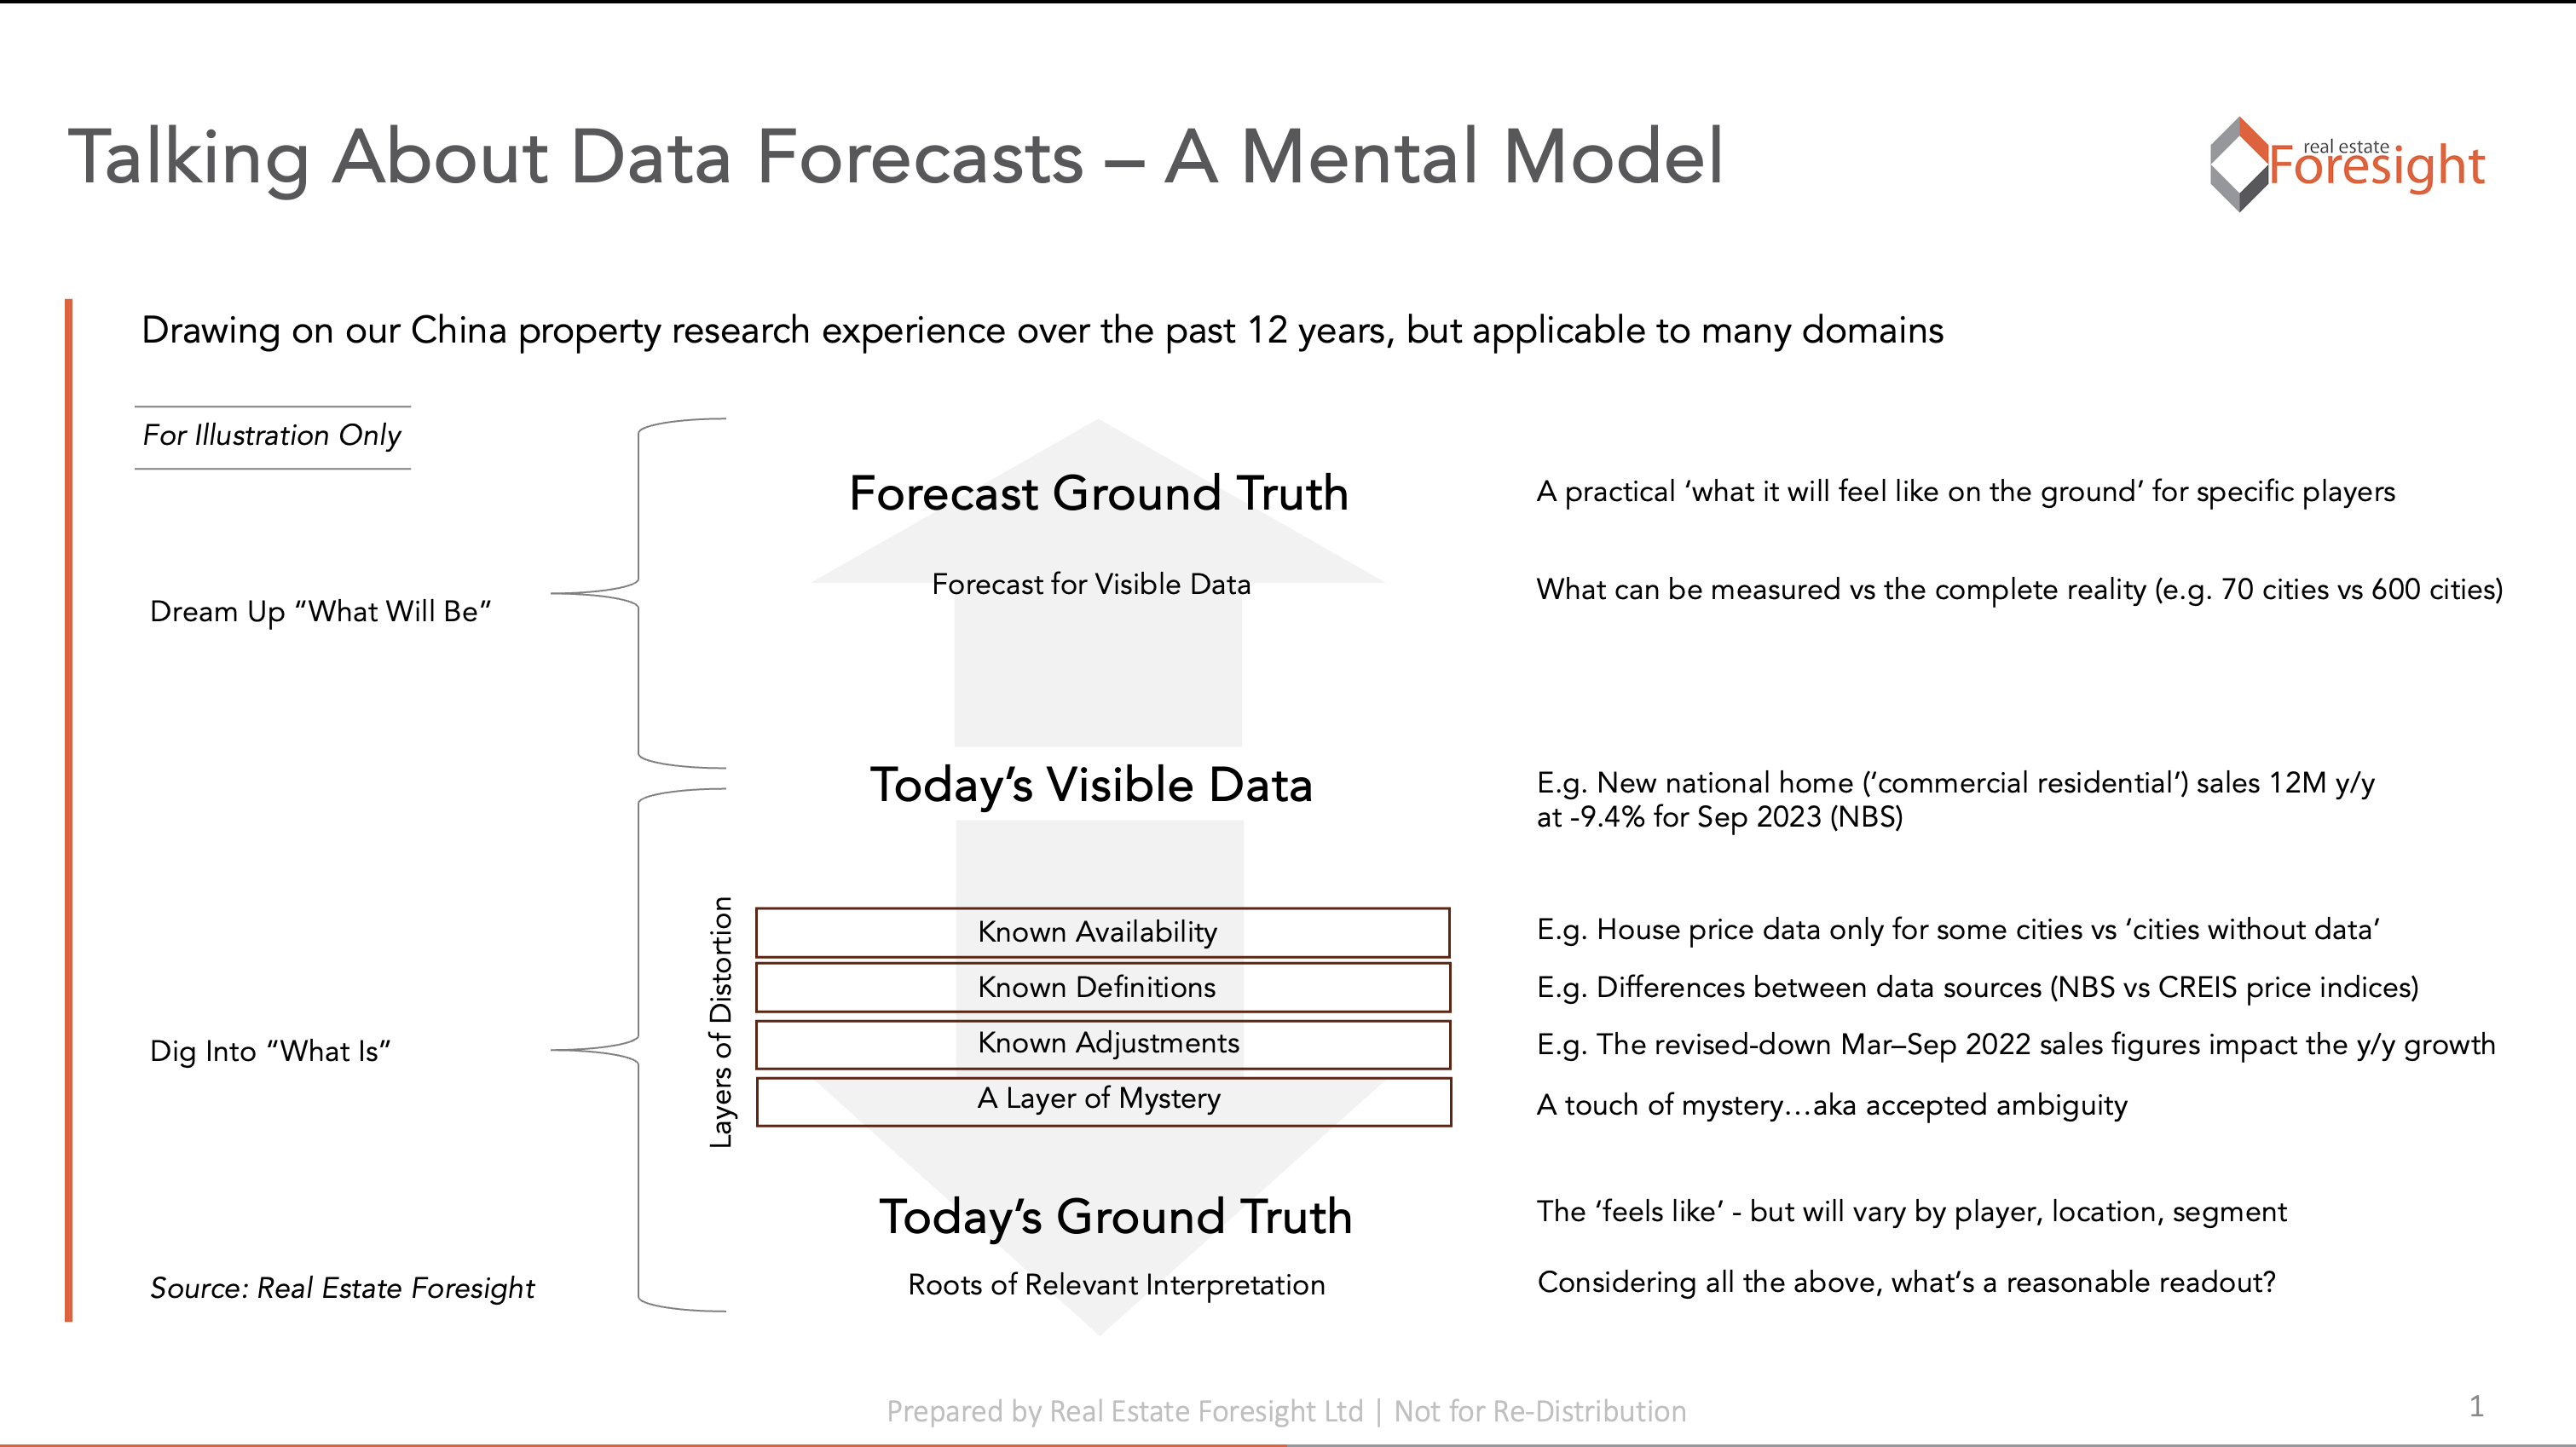
With Real Estate Foresight's China research business, we've had recently more conversations with market participants about the data interpretation and related caveats than the actual views on the market, as well as the differences between 'what the data shows' and 'what it feels like on the ground'.
The schematic below is our attempt to organize the various data issues into a simple framework, with a couple of examples listed.
It's like a map for a deeper data-grounded discussion about the market.
Kind of obvious, but how many forecasts or data readouts explicitly state what they refer to along those dimensions?
This is based on our experience in researching the China housing markets over the past 12 years, but the same could apply to any sector, any country.
For China property specifically, we do spend a lot of time just digging into all the nuances of the data. Do reach out if you look at that sector.
